Using the A/B Cursors
This section describes how to read values from the measured waveform using the A/B cursors. You can also use the cursors to specify a range for saving data or performing numerical calculations.
Reading values from the waveforms
This section describes how to read measured values, times, and time differences between cursors using the A/B cursors.
When using the scaling function, post-scaling values are displayed.

The A/B cursors will be displayed on the screen.
When the Cursor icon is displayed, pressing the any one of the keys will automatically change the setting to even with the A/B cursors set to .
|
|
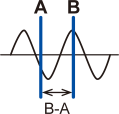
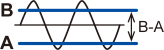
Vertical axis cursors
|
|
|---|---|---|
|
|
Horizontal axis cursors
|
|
- *1
The instrument expresses minute, a unit of time, included in cursor reading values in terms of the letter “m” instead of “min”.
|
|
A cursor measured value, B cursor measured value |
|---|---|
|
|
A cursor measured value, difference in measured values at the B and A cursors (B-A) |
|
|
B cursor measured value, difference in measured values at the B and A cursors (B-A) |
|
|
A cursor measured value, channel comments |
|
|
B cursor measured value, channel comments |
|
|
Difference in measured values at the B and A cursors (B-A), channel comments |
|
☑ |
Moves only the A cursor. |
|---|---|
|
|
Moves only the B cursor. |
|
|
Moves the A and B cursors at the same time. |
Each time you press the key, the display will switch between the Cursor icon (A/B cursor movement) and the Scroll icon (waveform movement).
For more information about the Cursor icon, see “1.13 Observing Waveforms” in the Instruction Manual.
Key operation
|
|
Moves the cursor left a large amount |
+ |
Moves the cursor five frames to the left. |
|---|---|---|---|
|
|
Moves the cursor right a large amount |
+ |
Moves the cursor five frames to the right. |
|
|
Moves the cursor left a small amount |
+ |
Moves one screen to the left on the waveform (one horizontal frame for the displayed waveform). |
|
|
Moves the cursor right a small amount |
+ |
Moves one screen to the right on the waveform (one horizontal frame for the displayed waveform). |


- (1)
The values the A/B cursors read from waveforms will be displayed.
- (2)
Under the table, the frequency calculated from the A/B cursors will be displayed. The frequency is the inverse of the time of period the A/B cursors read.
|
|
Frequency derived from the period between the trigger point and the A cursor, frequency derived from the period between the trigger point and the B cursor |
|---|---|
|
|
Frequency derived from the period between the trigger point and the A cursor, frequency derived from the period between the A cursor and the B cursor |
|
|
Frequency calculated from the period between the trigger point and the B cursor, frequency derived from the period between the A cursor and the B cursor |
|
|
Frequency derived from the period between the trigger point and the A cursor |
|
|
Frequency derived from the period between the trigger point and the B cursor |
|
|
Frequency derived from the period between the A cursor and the B cursor |
You can use numerical calculations to calculate values such as the maximum value, minimum value, and average value for measured waveforms.
“6.1 Performing Numerical Calculations” in the Instruction Manual.